WAC researchers help to improve understanding about the likely sources and pathways for stream sedimentation associated with logging in the NYC Watershed.
Previous research on best management practice (BMP) implementation on timber harvests in the New York City (NYC) Watershed identified water diversion devices on skid trails and stream crossings as areas for improvement. While these studies provide insights about the extent to which timber harvest activities follow the New York State Forestry BMP field guide, they do not explicitly address BMP effectiveness. This study focused on understanding pathways of sediment delivery to stream channels as a means of improving BMP effectiveness to reduce erosion, slow down and spread out surface runoff, and trap and store sediment on the landscape.
In the summer of 2019, Stefni Krutz and I examined 22 miles of buffered streams associated with 43 recently harvested woodlots in the Catskill/Delaware (West-of-Hudson) NYC Watershed. Sites were harvested between 2014 and 2019 by loggers that participated in the Watershed Agricultural Council’s Forestry BMP cost-share program. Field surveys targeted evidence of sediment breakthroughs, or places where surface runoff left skid trails and flowed overland, carrying sediment to the stream channel. Study objectives were to quantify how often breakthroughs occur, identify their common causes, and make recommendations about BMP improvements to reduce sediment delivery to streams.

This sediment breakthrough occurred just uphill of a skid trail stream crossing (far right). In this case, a large tributary flowed across the trail and continued on to the buffered stream.
On average, we found about 8 sediment breakthroughs per mile of buffer surveyed, but breakthrough frequency was variable, ranging from 0 to 56 breakthroughs/mile. 12 of 43 sites had no breakthroughs at all. Thirty percent of breakthroughs were associated with skid trail approaches to stream crossings. The remainder (aka non-crossing breakthroughs) were related to surface runoff from tributaries and seeps that flowed down or across skid trails en route to the stream.
What caused variability in breakthrough spatial frequency across sites? We anticipated that we would find more breakthroughs at recently harvested sites or sites with more skid trails located within stream buffers, but neither case held true.

Breakthrough spatial frequency (breakthroughs per mile of buffer surveyed) showed no trend over time.
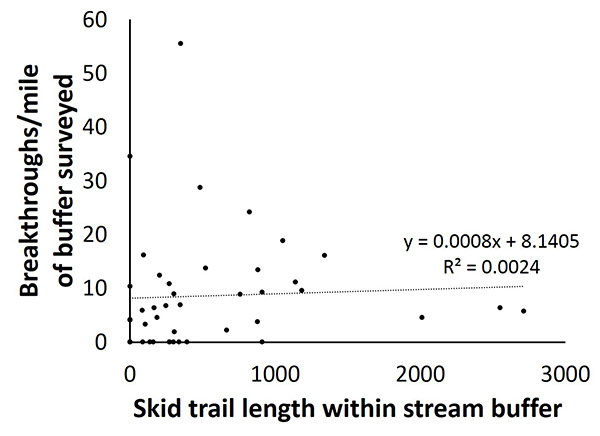
Breakthrough spatial frequency (breakthroughs per mile of buffer surveyed) showed no trend with increasing trail length within the stream buffer.
Breakthrough likelihood was best explained by the drainage area of tributaries and seeps that interacted with skid trails and flowed on to the buffered streams we surveyed. The bigger the drainage area, the more likely a breakthrough would be found. The drainage area of these tributaries and seeps was indicated by color-coded flowlines on the maps we imported to Avenza for field navigation and data collection. Drainage area ranged from 0.1 to 0.5 acres for the light blue flowlines, 0.5 to 6.2 acres for medium blue flowlines, 6.2 to 24.7 acres for dark blue flowlines, and more than 24.7 acres for very dark blue flowlines.

From Left to Right: A light blue, dark blue, and medium blue flowline that interacted with the skid trail and resulted in sediment breakthroughs. The green pins show where surface runoff left the trail, broke through the buffer edge (in purple), and reached the stream (center purple line). Note that WB stands for water bar.
85% of breakthroughs were associated with a flowline-trail interaction on the map. However, there were many flowline-trail interactions on a given property (on average, 50 per mile of stream buffer surveyed). So how do you know which ones will result in a sediment breakthrough? To shed light on how flowline drainage area relates to breakthrough likelihood, Stefni counted the number of light blue, medium blue, dark blue, and very dark blue flowlines for each property that interacted with skid trails before flowing on to the buffered streams we surveyed. These were called ‘map breakthroughs’. She compared the number of actual breakthroughs to map breakthroughs.
69% of map breakthroughs where a very dark blue flowline was involved turned out to be actual breakthroughs on the ground. For map breakthroughs involving dark blue, medium blue, and light blue flowlines, they turned out to be actual breakthroughs in 37, 12, and 8% of cases, respectively. This means that flowline drainage area is a reasonable predictor of breakthrough likelihood and that our Watershed foresters can use this information to anticipate potential water quality problem areas early on in the harvest planning process.
A secondary objective of this study was to estimate potential erosion rates at stream crossings. Stream crossings represent places where surface erosion from the trail has a high probability of connecting with the stream. We used the Universal Soil Loss Equation modified for forest land to estimate potential erosion on the approaches to 48 skid trail stream crossings. Potential erosion ranged from 0 to 968 lbs. of sediment per year with an average of 37 lbs. per year. 80% of the approaches evaluated had potential erosion rates of 22 lbs. per year or less, which suggests that most stream crossings are being closed out in a way that protects water quality over the long term.

The potential erosion rate for this stream crossing approach was 968 lbs. per year, which was the highest in the study. This approach was 191 feet long, with a 20% slope and 40% bare soil. It needs a water bar or two and some surface cover. Time since harvest completion was one month.

The potential erosion rate for this stream crossing approach was 0 lbs. per year. Multiple water bars provided water control on this steep approach and netting, grass seed, and straw mulch were used for surface cover. 34 months after the harvest, the approach had nearly 100% surface cover.

The other approach looked pretty good too.
Potential erosion was highest for the most recently harvested sites. This illustrates the importance of using water quality BMPs during the harvest.

Potential erosion rates decreased over time for the 76 stream crossing approaches evaluated. One year or more after harvest completion, the mean potential erosion rate was 5.5 lbs per year.
So what does all of this mean for the WAC BMP program? I think this research supports the idea that old trusty BMPs are as important as ever. For example, keeping skid trails away from streams and locating crossings to avoid approaches that will be overly steep. Judicious use of water bars on skid trails are essential to slow down and spread out surface runoff. Perhaps most importantly, this study showed that WAC foresters can use flowline information to anticipate potential water quality problem areas.


